Data engineering is a competitive field, and top talent can afford to be fussy with where they choose to work. Attracting these folks means offering the right pay – but how do you balance staying competitive and managing your budget?
Our guide has the answers. Dive in to discover what data engineers are paid based on their experience, qualifications, location, and more.
How we researched this topic
We usually pull information from the US Bureau of Labor Statistics (BLS). However, the BLS’s reports don’t currently recognize data engineers as separate from data scientists or software developers. So, we had to dig a little deeper and piece things together from other reliable sources – including Zippa, Talent.com, Salary.com, Apartments.com, and more.
Key takeaways
The average data engineer in the US earns around $130,000 per year.
Entry-level positions usually pay between $68,000 and $111,000, while top earners can expect to take home over $159,000.
Salary can vary based on skills, experience, qualifications, geography, and industry.
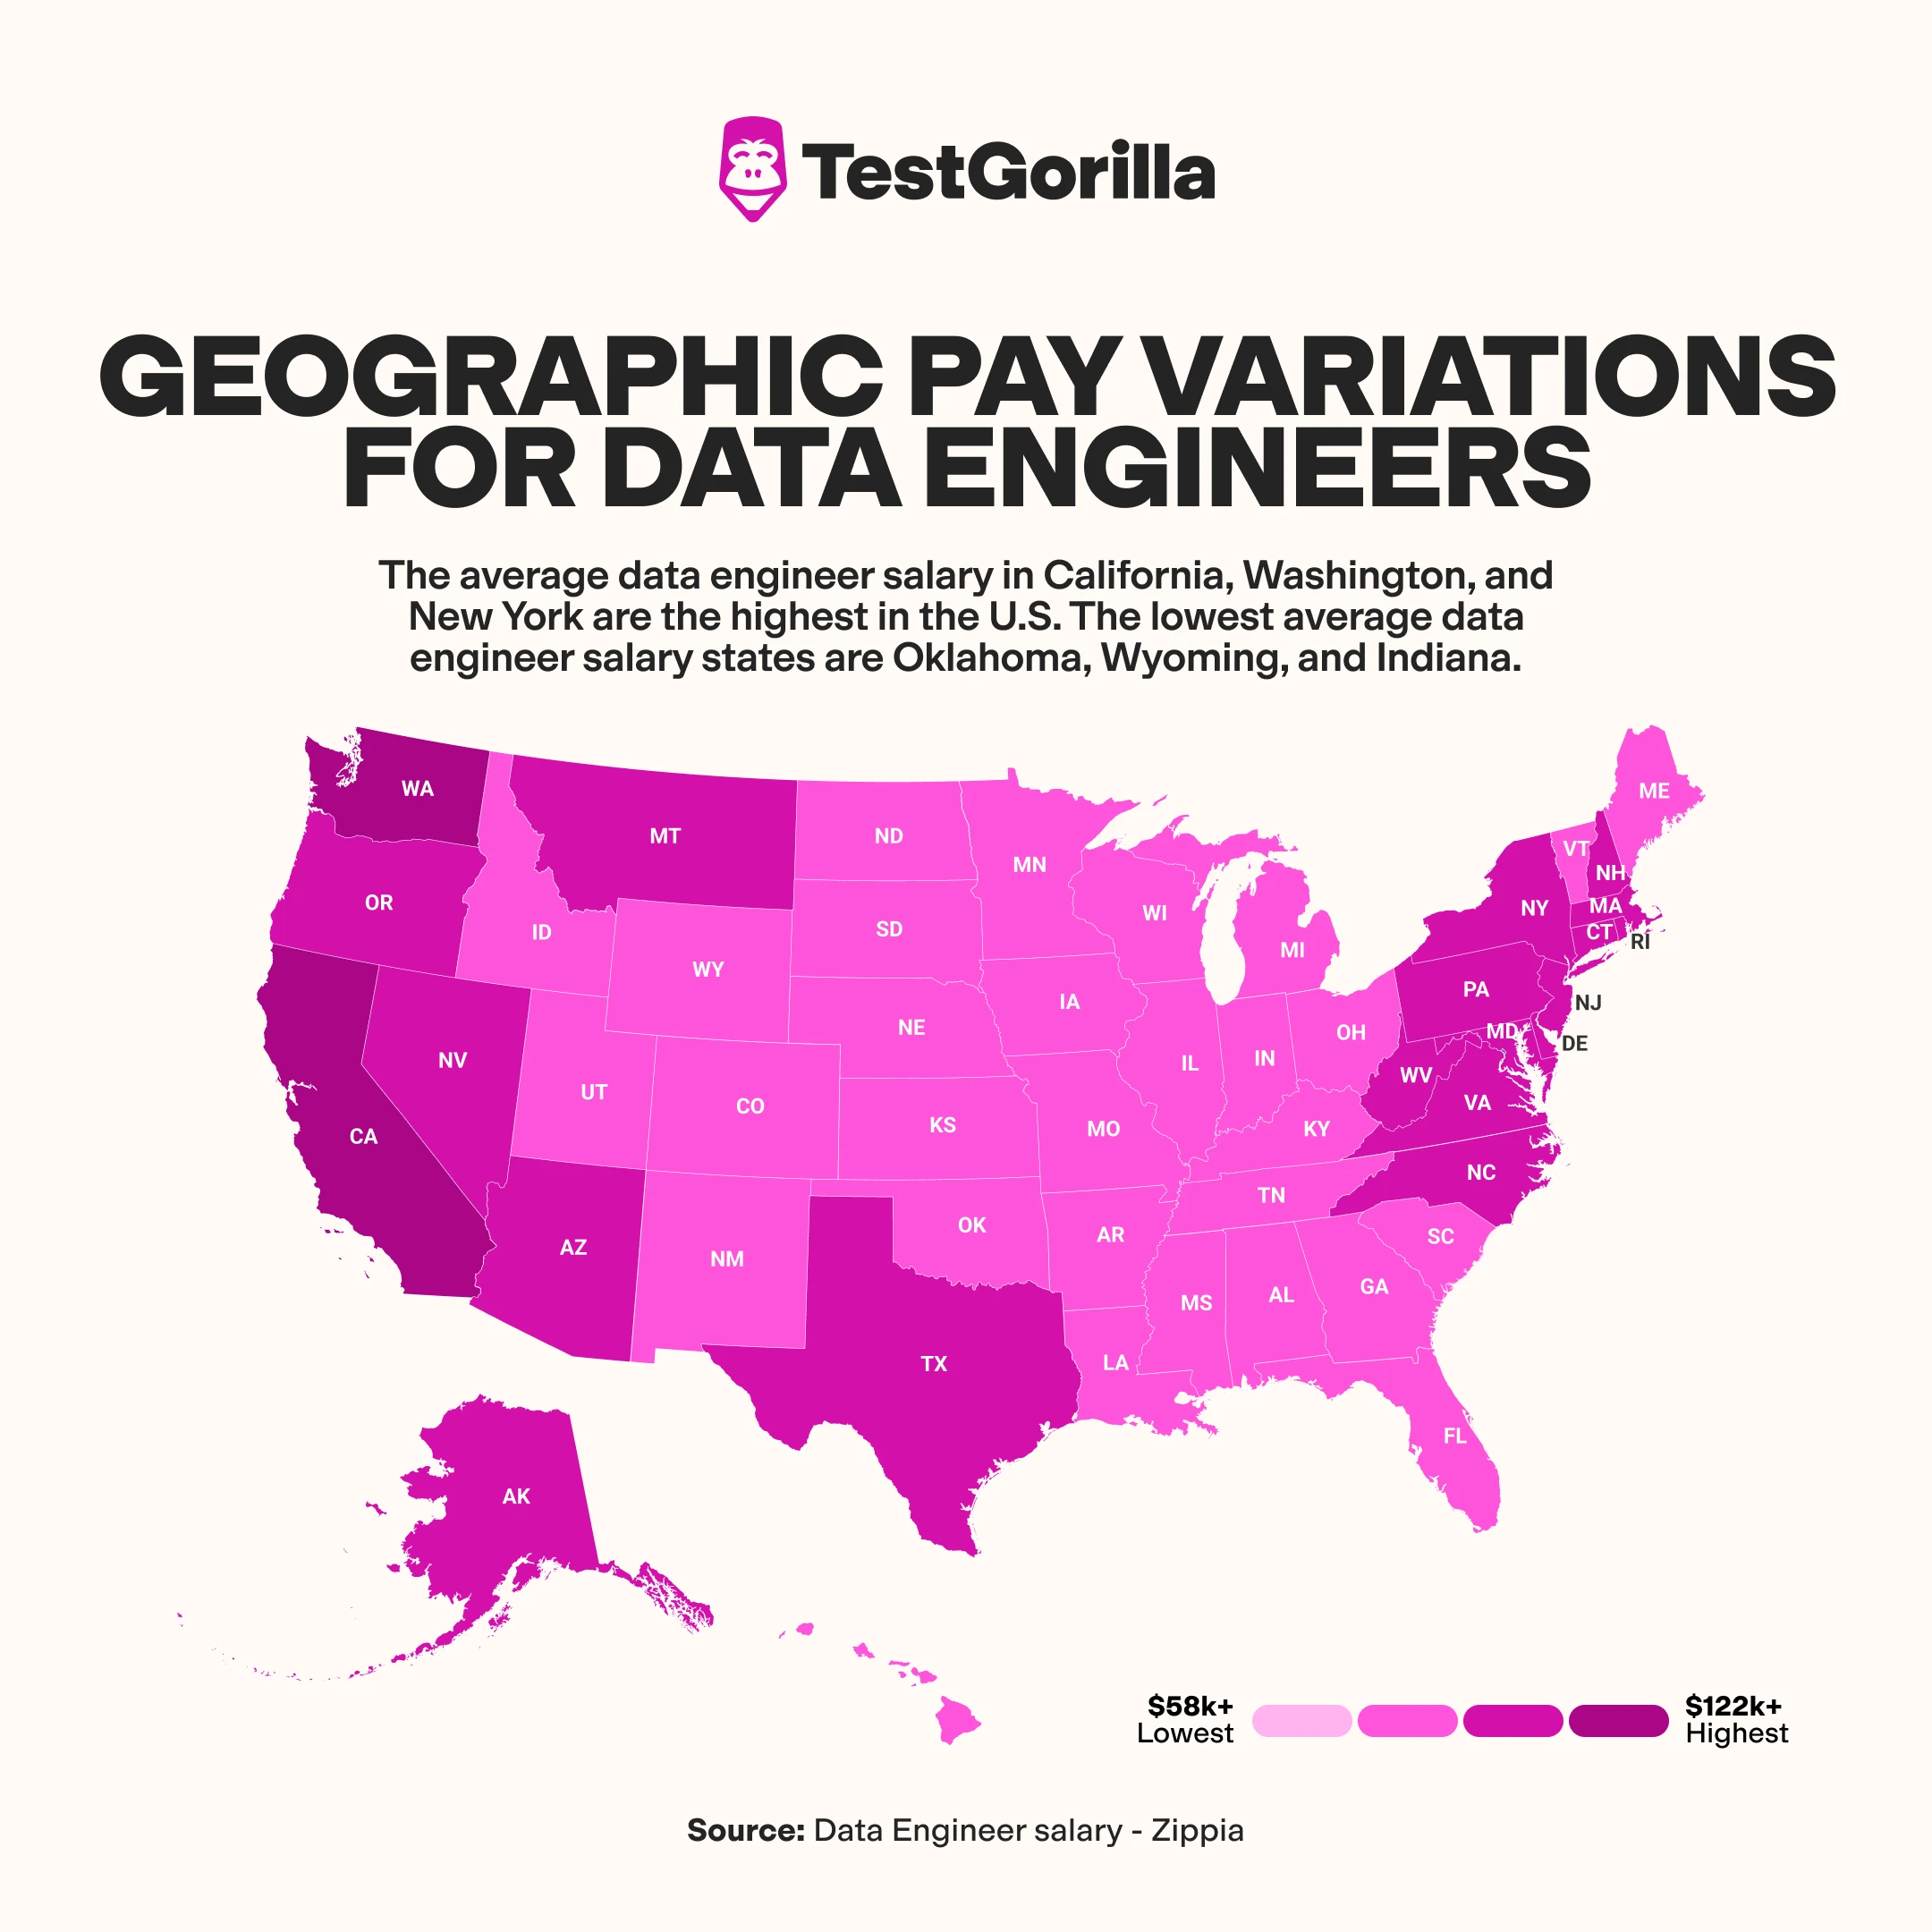
States like Rhode Island, California, Washington, and Oregon offer the highest salaries for data engineers. States like Kansas, Alabama, and Mississippi tend to pay less.
National salary statistics for data engineers
Pay metric | Annual salary (USD) | Hourly wage (USD) |
Median | $130,373
| $62.68 |
Mean | $124,193 | $59.71 |
Top 10% earners | $159,371 | $76.62 |
Bottom 10% earners | $98,072 | $47.15 |
Median vs. mean salary
Mean and median earnings are useful benchmarks when deciding what to pay a data engineer.
The mean (or average) salary is the total salary of all data engineers in the US, divided by the number of data engineers. It’s a good overall snapshot, but it can get skewed by especially high or low earners.
The median salary, on the other hand, is the middle point: 50% of earners will be above this and 50% below. It’s less affected by outliers, making it a useful reference point.
Considering both of these together gives you a solid overview of salary trends.
Factors influencing salaries
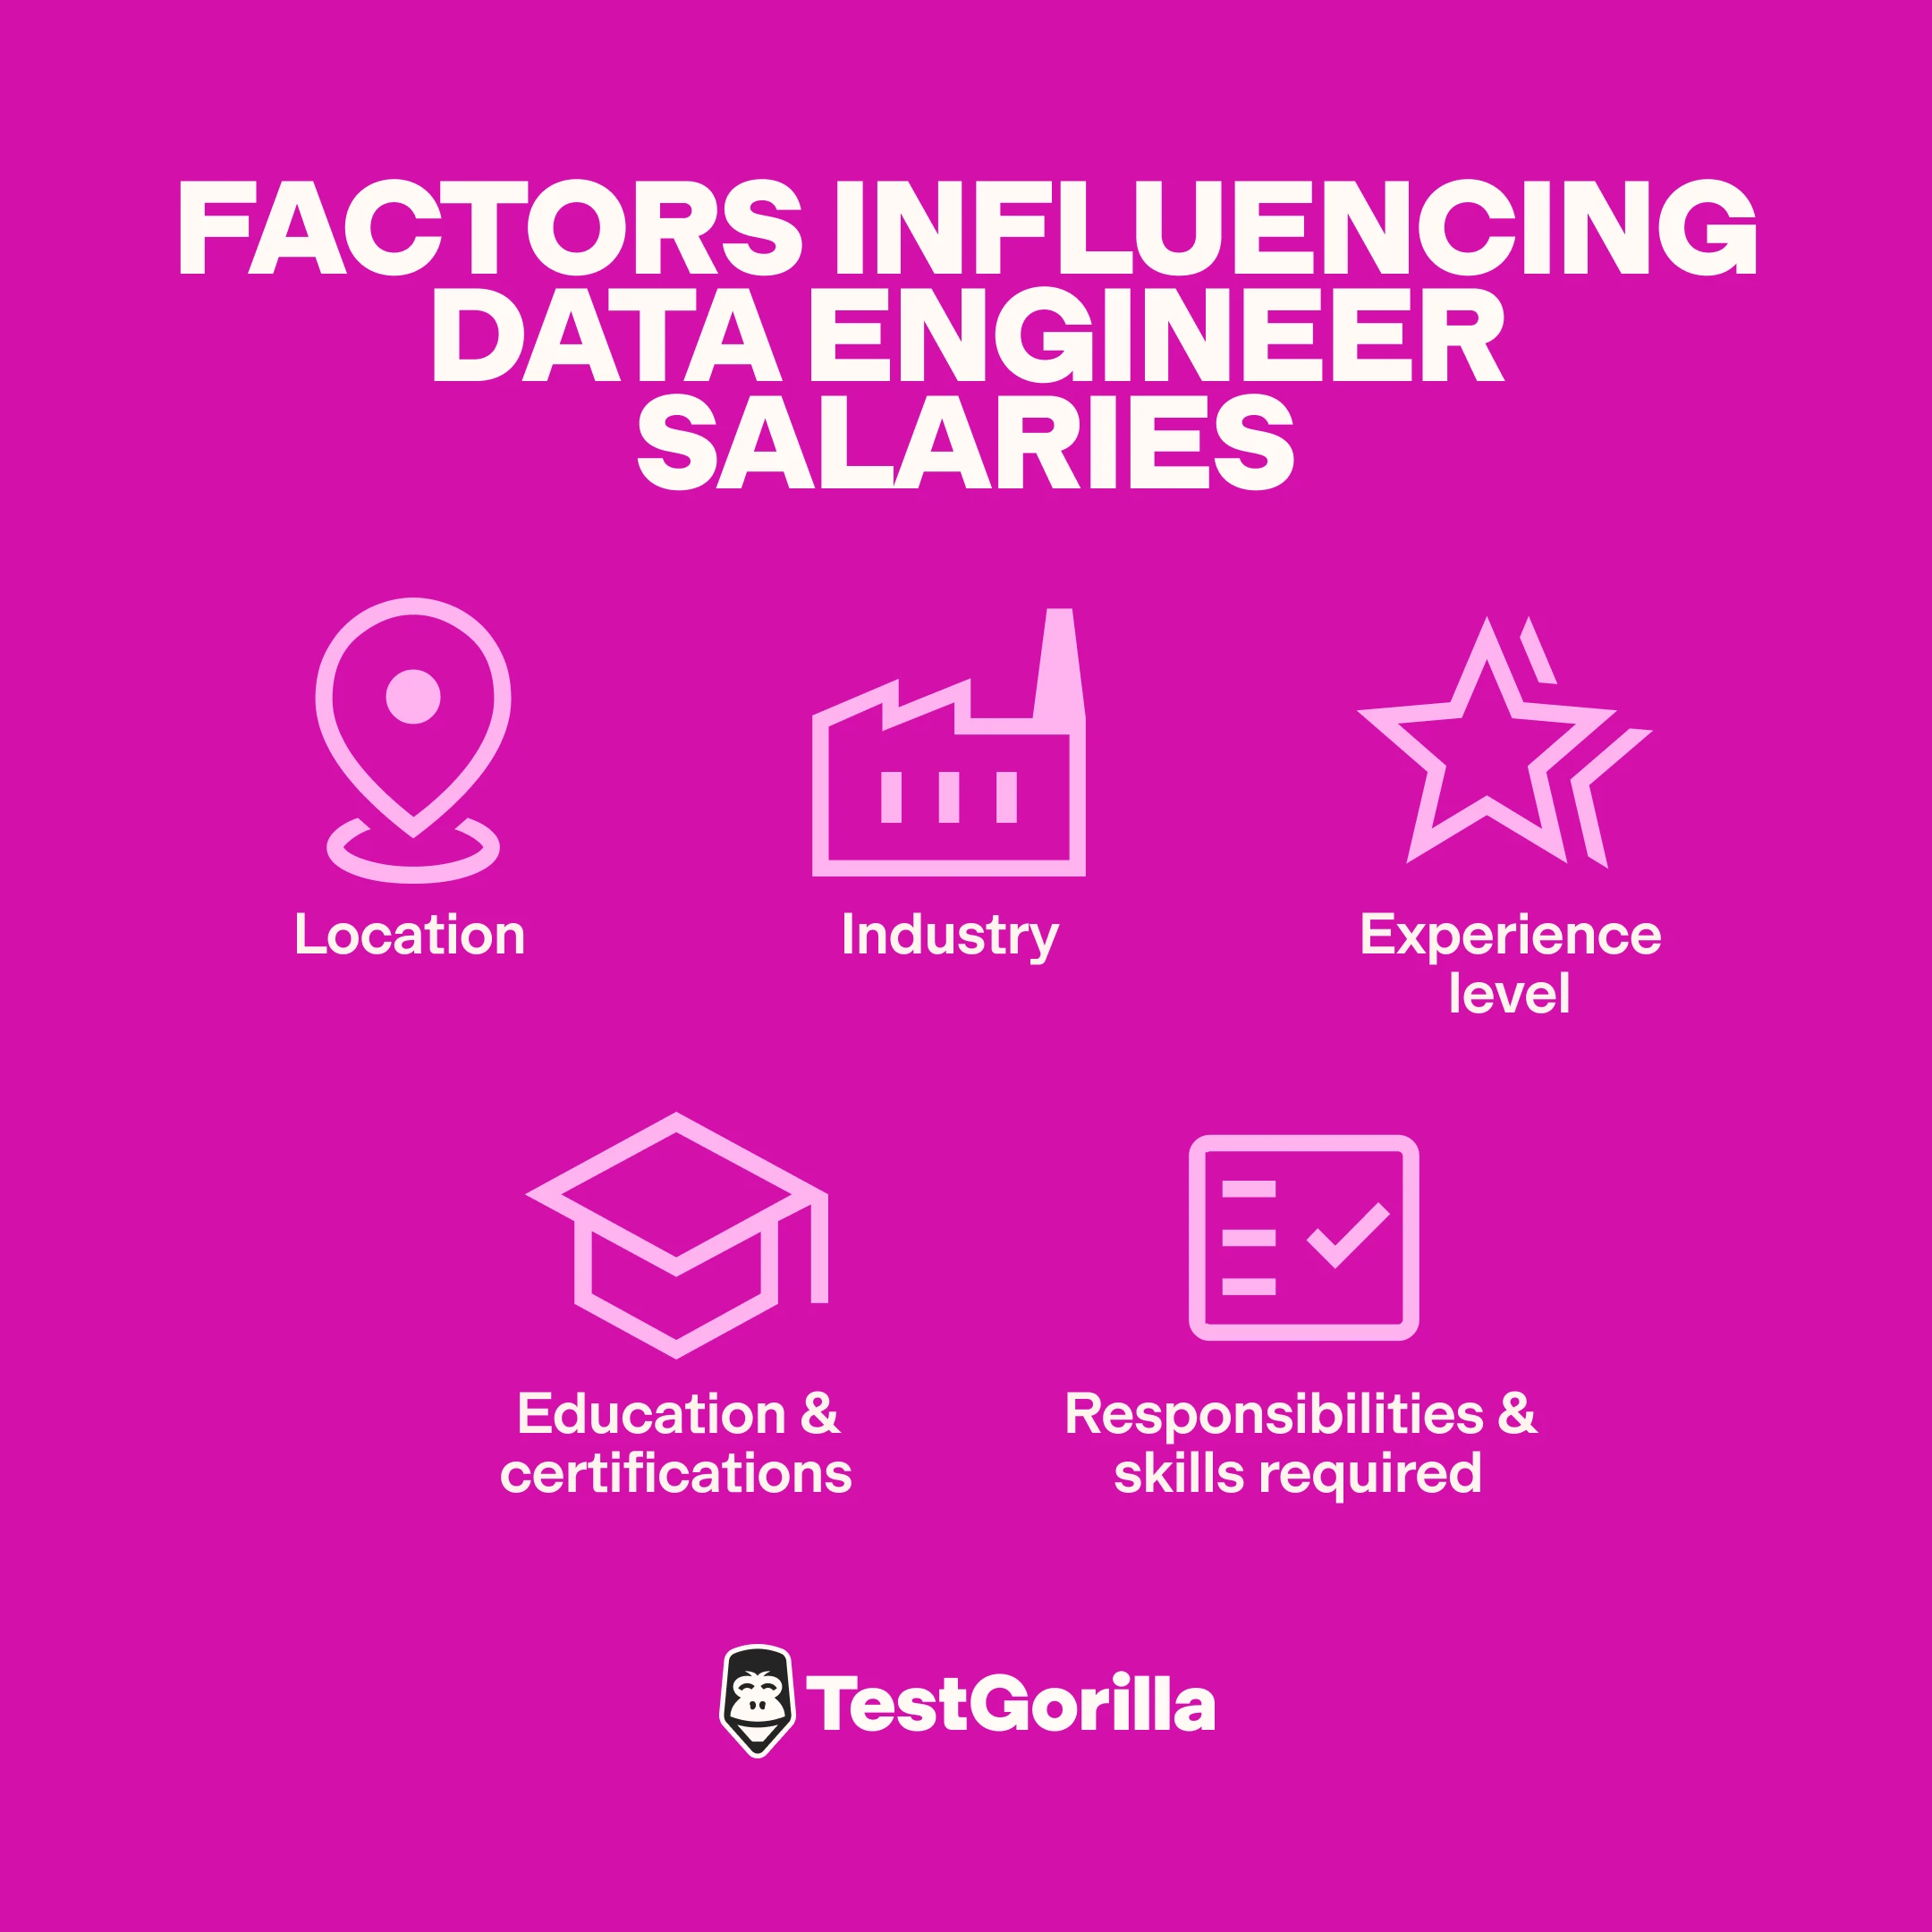
Several factors influence data engineering salaries, including:
Geographic location: High-cost-of-living (HCoL) areas like California, New York, and Washington, DC, tend to offer higher salaries, while low-cost-of-living (LCoL) areas generally offer less. For example, the average salary for a data engineer in California is $122,671, while those living and working in Alabama can expect to be paid $79,953.
Industry: Data engineers working in tech, mining, agriculture, and healthcare typically earn more than those working in generic professional industries like marketing. Tech companies rely heavily on data engineers to manage and analyze vast amounts of information, while healthcare uses data to improve patient care. As a result, data engineers in these industries can expect to earn more.
Experience level: Data engineers with more years of experience can earn higher salaries than their less experienced counterparts.
Education and certifications: A bachelor’s degree in computer science, engineering, or a related field is typically a baseline for data engineers, but advanced degrees or certifications in specialized areas can boost salaries even further. Certifications in cloud platforms (AWS, Azure, Google Cloud) or big data tools often signal to employers that a candidate has a deeper level of expertise, increasing their salary potential.
Responsibilities and skills required: Data engineers who know advanced tools and frameworks like Apache Spark, Hadoop, or Kubernetes tend to earn higher salaries. Likewise, engineers who manage teams, lead large-scale projects, or design complex data architectures typically earn more due to their added responsibility.
Geographic pay variations
The darkest colors on the map denote the states with the highest pay for data engineers. These states have a total mean salary of $107,349 and include:
California
Washington
Oregon
Rhode Island
New York
On the other hand, the lighter colors on the map denote the states with the lowest average salaries. These include the following states, where the total average salary is $81,003:
Kansas
Alabama
Oklahoma
Mississippi
Louisiana
Why the difference in pay?
The cost of living in these states plays a key role in the pay differences. While salaries may be lower in states like Alabama and Louisiana, they’re often balanced by the lower costs of living. For example, a two-bedroom apartment in New York costs around $2,300 per month, while a two-bedroom house in Kansas costs around $900 per month.
Industry-specific pay data
Next, let’s explore how data engineers’ salaries differ across industries.*
*Finding industry-specific information for this role was challenging, so we combined data from Salary.com and Glassdoor, which collate salary estimates and trends from employer job postings and third-party sources.
Higher-paying industries | Median annual salary | Lower-paying industries | Average annual salary |
Arts, entertainment, and recreation | $147,276 | Education | $80,000-$110,000 |
Energy, mining, and utilities | $143,944 | Non-profits | $70,000-$90,000 |
Agriculture | $142,040 | Marketing and advertising | $85,000-$110,000 |
Financial services | $136,986 | Retail | $70,000-$105,000 |
Technology | $125,571 | Public sector | $70,000-$95,000 |
Why the salary differences?
Data focus: Some industries rely heavily on data to drive their operations, decision-making, and long-term strategy, which pushes salaries higher.
Industry norms: Some industries historically pay more than others. For example, sectors like energy, agriculture, and financial services are known for their higher salaries due to the complexity and scale of their operations. On the flip side, industries like education, non-profits, and the public sector often have tighter budgets and may be publicly funded, which naturally limits how much they can offer.
Demand: Some industries – like tech and financial services – need highly skilled and talented employees to tackle unique challenges. This demand necessitates higher salaries.
Non-salary benefits: Industries that famously offer more non-salary-related benefits may offer lower salaries to compensate. For instance, sectors like education, non-profits, and the public sector often provide perks like generous vacation policies, pension plans, tuition reimbursement, or job stability, which can offset the lower pay.
Pay by experience and education
Experience and education significantly impact the salaries data engineers can earn. Although a bachelor’s degree is the standard requirement, those with additional degrees or special certifications in specialized areas like cloud computing, big data, or machine learning often command higher salaries.
Experience level
Entry-level (0-1 years): $68,000-$111,000
Mid-level (2-4 years): $78,000-$123,000
Experienced (5+ years): $87,000-$137,000
Education and qualifications
Associate’s degree: $74,000-$107,000
Bachelor’s degree: $82,000 - $113,000
Master’s degree: $110,000- $156,000
Doctorate: $110,000- $156,000
Interestingly, we couldn’t find any data to suggest that earning anything beyond a master’s degree impacts salary.
However, data engineers with several additional certifications may be able to command higher salaries due to their specialized skill sets and expertise in high-demand areas. Look out for certifications like:
AWS Certified Data Analytics
Google Professional Data Engineer
Cloudera Data Engineer
Arcitura Big Data Architect
Databricks Certified Data Engineer
IBM Data Engineering Professional
SnowPro Advanced Data Engineer
Microsoft Certified: Azure Data Engineer Associate
The best insights on HR and recruitment, delivered to your inbox.
Biweekly updates. No spam. Unsubscribe any time.
Benefits beyond salary
Data engineering is a competitive field, and if you want the crème de la crème of applicants, you’ll need to offer a range of benefits beyond salary. Consider these benefits:
Remote working: Data engineering is tech-focused, meaning most engineers can work anywhere with electricity and a Wi-Fi connection. So, consider offering remote working arrangements for your data engineers to support a healthy work-life balance and reduce commuter fatigue.
Health insurance: Health insurance is a normal and expected part of most compensation packages. However, you may want to consider more comprehensive plans to attract top talent. Additional perks like dental, vision, mental health support, and wellness programs are frequently being rolled into health insurance packages, and star candidates will be on the lookout for these benefits.
Retirement plans: Providing solid retirement planning support – through 401(k)s, financial planning services, vesting options, or other pension products – can be a big draw for data engineers thinking about their futures.
Professional development: Technology changes quickly, and a company that invests in a developer’s education shows a commitment to long-term growth. Offering support for certifications, degrees, and training courses can set you apart from other employers.
Level up your hiring process with talent assessments
Although offering fair compensation is essential when hiring a data engineer, you also need to find the person with the right skills, experience, and traits that fit your team.
With more than 350+ tests, TestGorilla helps you go beyond resumes to make data-driven hiring decisions. You can combine up to five tests to create a custom assessment, measuring everything from data literacy and typing speed to personality type.
These data engineer tests are ideal for evaluating your future candidates:
Algorithms for Software Engineering test
Critical Thinking test
Artificial Intelligence test
Machine Learning test
Data Science test
Sign up for your free account or schedule a free demo today to see how TestGorilla can simplify hiring your next data engineer.
FAQs
Can a data engineer make $200,000?
While the average annual salary for data engineers in the US is around $130,000, they can potentially make $200,000 if they have many years of experience, work in a competitive industry, have highly specialized skills, possess advanced qualifications, etc.
Do data engineers code a lot?
Yes, coding is a big part of a data engineer’s job. They mainly code to build data pipelines, manage databases, and automate processes.
You've scrolled this far
Why not try TestGorilla for free, and see what happens when you put skills first.


