Employee turnover statistics: Everything you need to know
Employee turnover undermines workforce stability, disrupts company culture, and affects the bottom line. Managing high turnover rates can feel like a constant battle between making sure new hires remain committed and retaining skilled employees.
Fear not: This guide dives deep into the latest employee turnover statistics to look at the causes and costs of employee turnover – as well as solutions to help you retain your employees and keep your workforce stable and engaged.
How we researched this topic
Our analysis draws from the comprehensive employer data sourced by the US Bureau of Labor Statistics (BLS). Additionally, we’ve included stats from other reputable sources (such as industry-leading organizations like Gallup) to highlight more turnover rates, costs, and trends.
Key takeaways
Voluntary turnover rates tend to be higher than involuntary turnover rates.
The employee turnover rate varies significantly by industry – for instance, in October 2024, it was 5.1% in leisure and hospitality and 1.3% in government.
Reduce employee turnover to decrease the direct costs of turnover – like separation, recruitment, and training costs – plus indirect costs like productivity loss, low morale, and loss of institutional knowledge.
Current employee turnover rates
Here are some recent turnover rates.
Voluntary vs. involuntary turnover
Voluntary turnover occurs when employees quit their roles. Involuntary turnover occurs when the employer ends the working relationship – and includes layoffs.
According to the BLS’s most recent Job Openings and Labor Turnover (JOLTS) survey, the voluntary turnover rate for October 2024 was 2.1% across all industries. The highest voluntary turnover rate was 4.3% in food and accommodation, and the lowest was 0.5% in federal government.
This same survey revealed that the involuntary turnover rate for October 2024 was 1% across all industries. The highest involuntary turnover rate was 2.6% in arts, entertainment, and recreation, and the lowest rate was 0.2% in federal government.
Meanwhile, the SHRM found that the average annual rate for voluntary turnover in 2022 was 23%, while it was 11% for involuntary turnover.
Check out our guide on preventing voluntary turnover.
Turnover by industry
Turnover rates vary widely between industries.
According to recent JOLTS data, here are a few of the highest and lowest monthly turnover rates in the US by industry.
Industry | |
Leisure and hospitality | 5.1% |
Professional and business services | 4.8% |
Trade, transportation, and utilities | 3.6% |
Information | 2.4% |
Financial activities | 2.1% |
Government | 1.3% |
*Please note that JOLTS provides data on subcategories of these industries, and these sub-industries might have higher or lower turnover rates. For instance, arts, entertainment, and recreation is a subcategory of leisure and hospitality, and this industry experienced a turnover rate of 6% in October 2024.
BLS data doesn’t currently include annual turnover rates, but a BLS document offers a formula for calculating annual rates from JOLTS total separations statistics:
Total number of separations for the year (i.e., the sum of the 12 monthly total separation levels) / annual average monthly employment for the year, multiplied by 100.
Annual average employment data should be gathered from the BLS’s Current Employment Statistics (CES).
We’ve used the provided formula formula to calculate the total annual turnover rate (including voluntary and involuntary turnover) for all nonfarm industries in 2023: It’s 43.62%.
Here’s the data we used:
Month | ||
January | 6,017,000 | 154,773,000 |
February | 5,833,000 | 155,060,000 |
March | 5,917,000 | 155,206,000 |
April | 5,569,000 | 155,484,000 |
May | 5,864,000 | 155,787,000 |
June | 5,639,000 | 156,027,000 |
July | 5,646,000 | 156,211,000 |
August | 5,609,000 | 156,421,000 |
September | 5,522,000 | 156,667,000 |
October | 5,630,000 | 156,832,000 |
November | 5,413,000 | 157,014,000 |
December | 5,419,000 | 157,304,000 |
| Total separations for 2023: 68,078,000 | Average employment level for 2023: 156,065,500 |
68,078,000/156,065,500 x 100 = approximately 43.62%.
You can replicate this to find annual turnover rates for any 12-month period and any industry using available BLS data.
Want to know your organization’s turnover rate? Check out our guide on calculating your turnover rate.
Turnover by workforce type
While BLS doesn’t break down employee turnover rates into different workforce types, we’ve gathered some other useful data from the SHRM. We break this down below:
Part-time workers tend to have higher turnover rates due to factors like job instability, fewer benefits, and lower levels of organizational commitment compared with full-time workers. The SHRM emphasizes that part-time roles often attract individuals seeking temporary or flexible work arrangements, contributing to their increased turnover rates. The SHRM also indicates that part-time roles are also more susceptible to churn in industries like retail and hospitality.
Full-time employees typically have more robust employment incentives like health insurance and retirement plans. They’re more likely to stay with organizations offering career development opportunities, stable work environments, and competitive benefits packages.
Turnover trends by demographics
While BLS doesn’t break down employee turnover by demographics, other sources have highlighted some trends. Here are just a few:
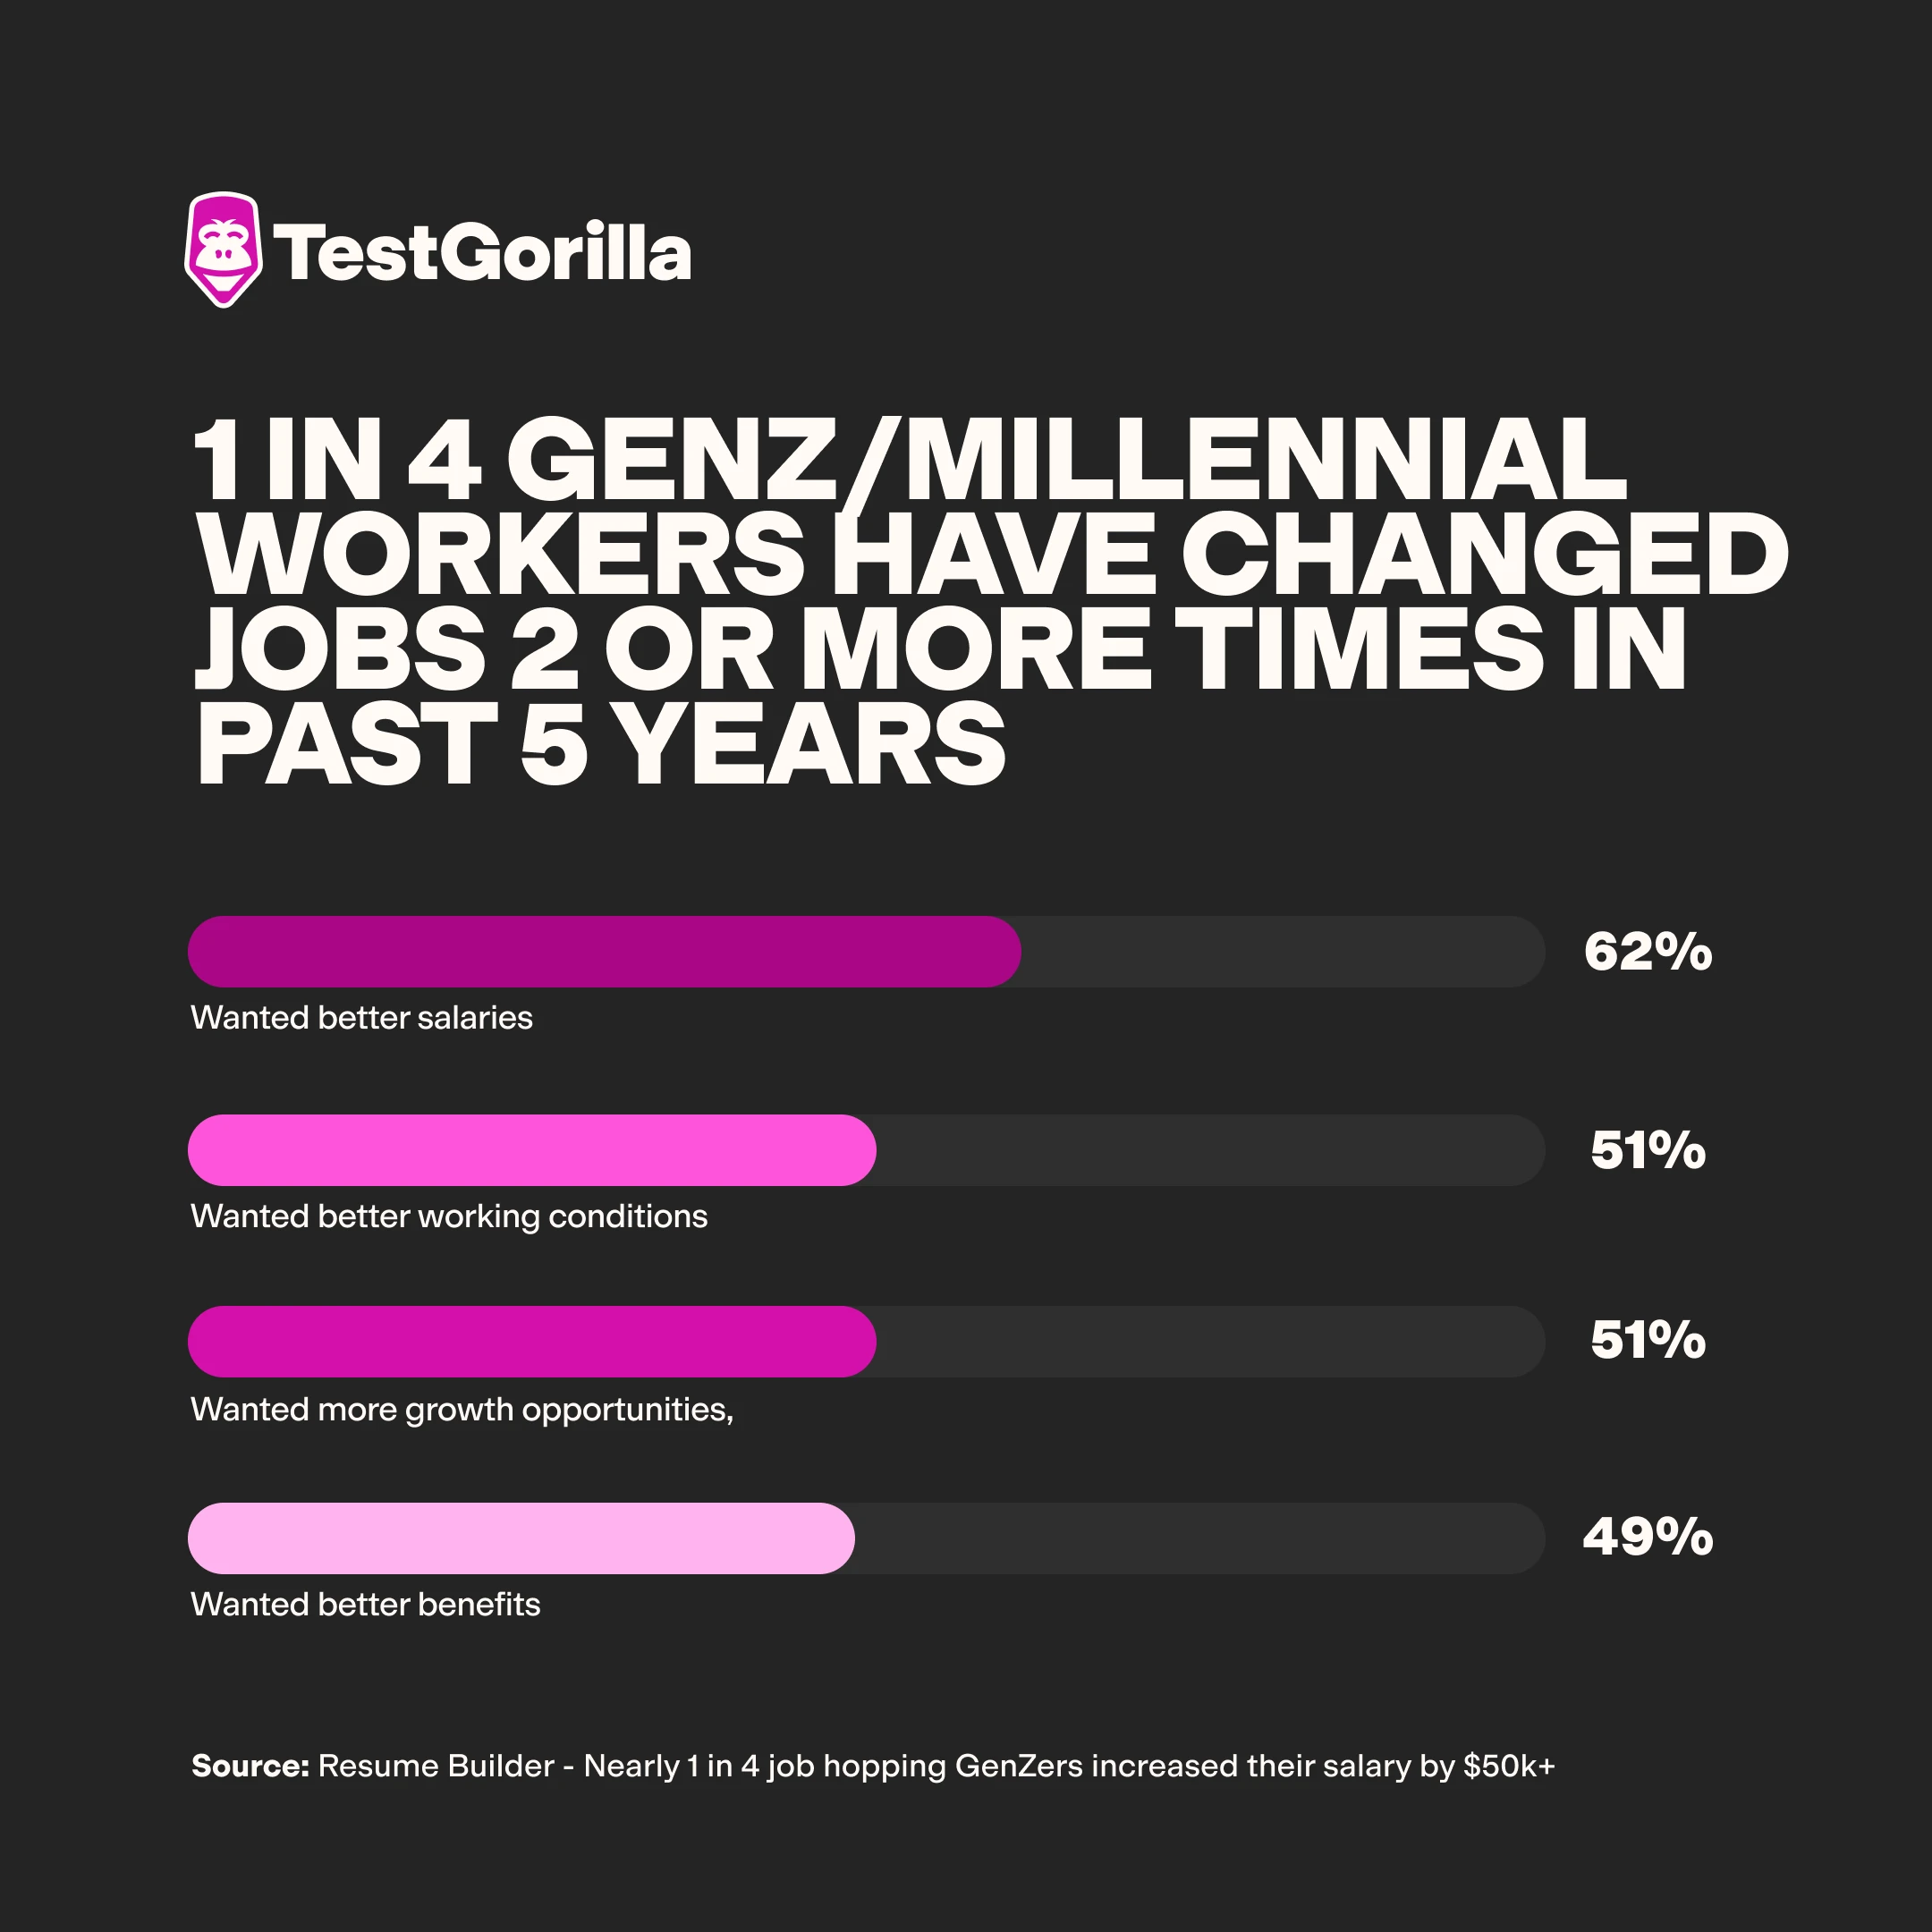
A 2023 Resume Builder survey of Gen Z and Millennials revealed that one in four respondents had left their jobs twice or more in the past five years. Sixty-two percent said they switched jobs because they wanted better salaries, 51% wanted better working conditions, 51% wanted more growth opportunities, and 49% wanted better benefits.
A study for Harvard Kennedy School found that Black employees are 32% more likely to experience turnover than White employees. The study also found that Black women are more likely to depart when they work with predominately White teams.
The Disability in the Workplace 2023 insights report shows that while the turnover rate for people with disabilities was 14.6% in 2021, it was nearly half (7.8%) in 2022. This might be due in part to more employers providing reasonable accommodations to people with disabilities – these accommodations had nearly doubled from 2021 to the time of the report’s publication.
The financial impact of turnover
Some employee turnover is natural. But high employee turnover has both direct and indirect costs that can significantly impact the financial health of affected companies.
Direct costs
The BLS doesn’t disclose data on the direct costs of turnover, but stats from the Center of American Progress indicate that the cost of finding, hiring, and training replacement employees is considerable. While these stats aren’t recent, they can still be illuminating for modern businesses – and they’re supported by more recent stats.
For instance, the SHRM found one business of 1,500 employees – experiencing a high employee turnover rate of 89% – assessed its employee turnover costs at $250,000 annually. Also, Gallup has stated that replacing exiting workers costs one-half to two times an employee's annual salary. This means the replacement cost for an employee with an average salary of $50,000 would be between $25,000 and $100,000.
Direct costs can include:
Separation costs: These are expenses related to the termination of employment – like exit interviews, severance packages, administration, and legal fees.
Recruitment agency fees: According to the VP of a recruitment and staffing firm, these fees are typically 20% to 30% of the annual salary of a candidate who’s been recruited via an agency.
Discover our guide to calculating employee turnover costs.
Indirect costs
Indirect costs also negatively impact the business (although they aren’t as easy to quantify). They include:
Missed or delayed revenue: Employee turnover disrupts business continuity, leading to missed deadlines, delayed revenue streams, and unmet client expectations. Departing employees often leave unfulfilled sales quotas or incomplete projects, so businesses must divert resources toward replacements rather than growth initiatives. For high-impact roles – such as high-powered sales teams – unfilled positions can significantly delay revenue recovery.
Increased risk of losing long-standing customers: When employees with direct customer relationships leave, businesses risk losing clients to competitors. Departing employees may take loyal customers with them or reduce service quality during transitions, harming retention. And bad customer service – a common consequence of employee turnover – can worsen client churn.
Productivity and morale drops: During turnover transitions, output drops as workloads get redistributed, increasing stress for remaining employees. This strain often results in reduced efficiency and higher burnout rates, perpetuating further turnover cycles.
Loss of institutional knowledge: Turnover can strip organizations of valuable institutional knowledge, particularly when experienced employees leave. This knowledge gap impacts operational efficiency and decision-making as new hires struggle to acclimate, leading to prolonged adjustment periods and increased training costs.
Disruption of workplace culture: High turnover destabilizes workplace culture, creating uncertainty and lower engagement among remaining staff. Toxic culture is a leading cause of dissatisfaction, with research indicating that cultural misalignment can drive up voluntary turnover within the first 90 days of employment, according to the 2022 Job Seeker Nation Report.
Increased risk of losing top talent: Organizations with high turnover often have demoralized employees – who eventually look for stability elsewhere. In competitive markets, even the best workers aren’t likely to stay in high-turnover roles when there are better opportunities elsewhere.
The best insights on HR and recruitment, delivered to your inbox.
Biweekly updates. No spam. Unsubscribe any time.
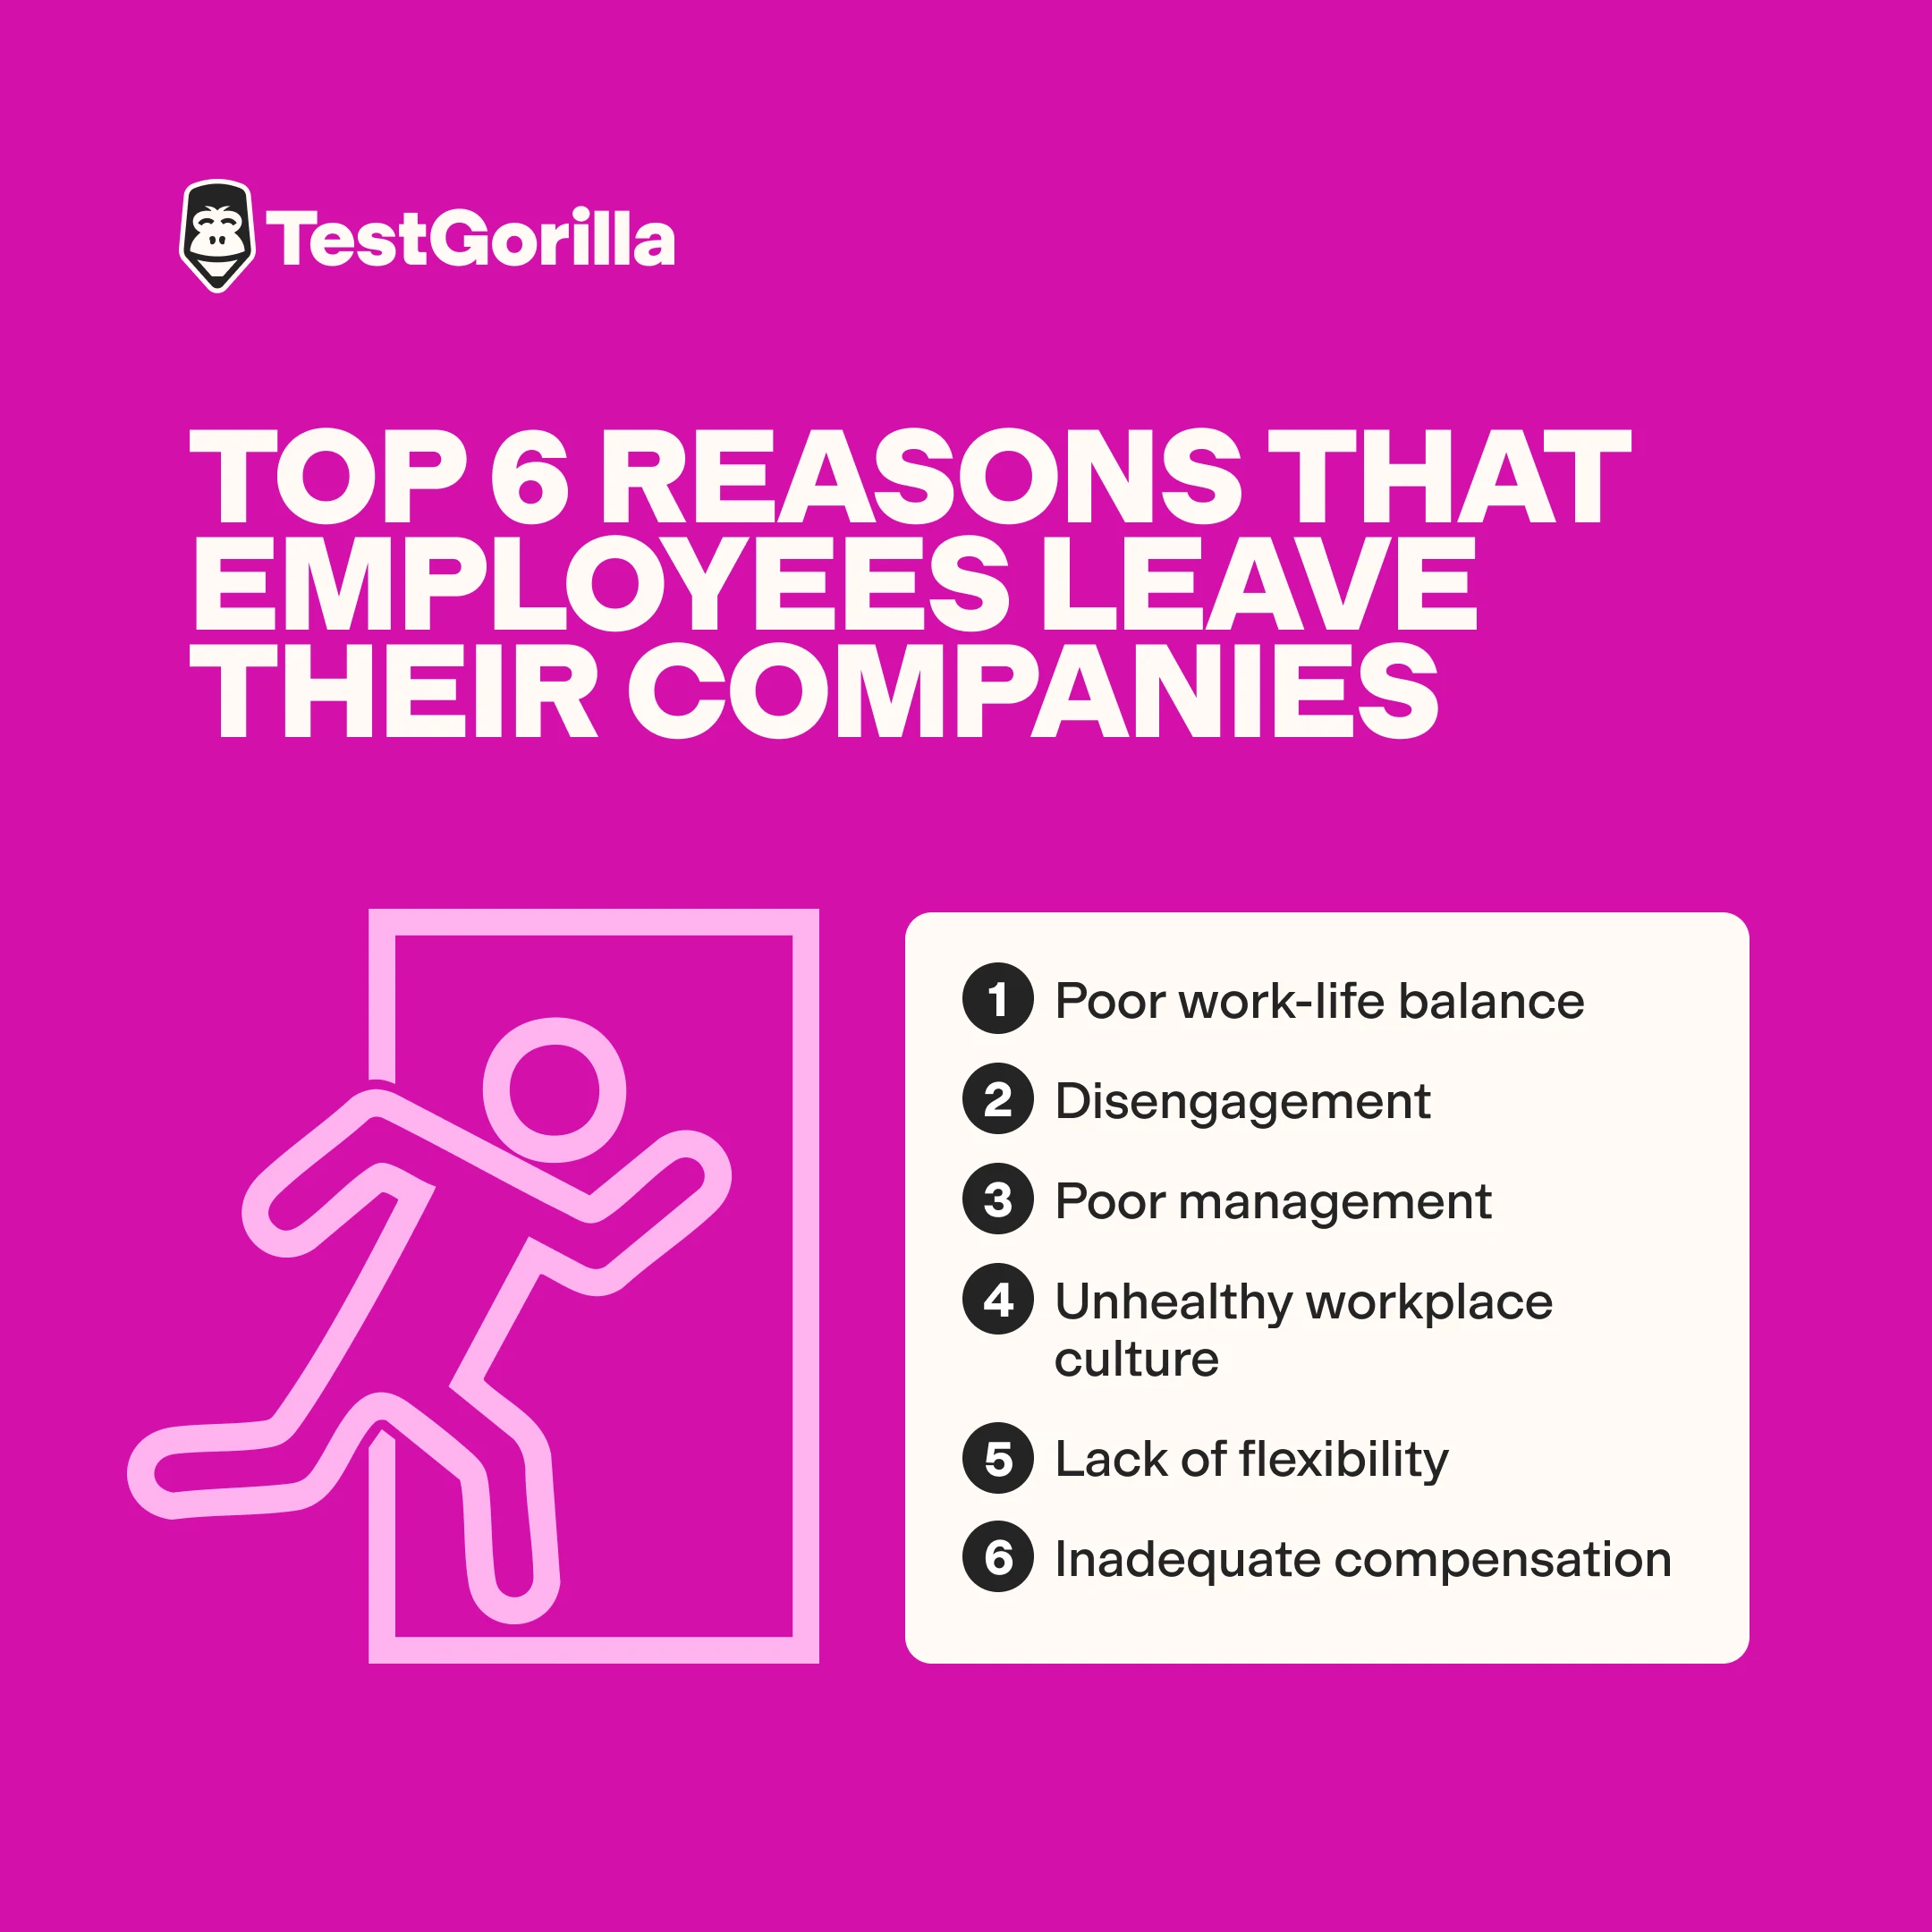
Top 6 reasons for high employee turnover (and what to do about it)
Below, we offer the key data-driven reasons that employees leave their companies:
1. Poor work-life balance
What the stats say: Gallup found that some organizations can spend around 15%-20% of total payroll in voluntary turnover costs due to burnout.
What to do about it: Offer and support work-life balance – for instance, by encouraging it as part of your workplace culture, providing support resources, and asking employees to take breaks and time off. Identify candidates with strong time-management and stress-resilience skills through assessments tailored to job demands. Hire those equipped to balance workloads and thrive in your work environment.
2. Disengagement
What the stats say: Gallup’s State of the Global Workplace report found that in the US and Canada, 52% of employees aren’t engaged, while 17% are actively disengaged. Gallup also found that high engagement teams typically have turnover rates that are 18% to 43% lower than low engagement teams.
What to do about it: Use employee engagement strategies – like employee recognition, leadership quality, professional development, and tailored career paths – to keep your workforce engaged.
3. Poor management
What the stats say: The SHRM’s 2019 “The High Cost of a Toxic Workplace Culture” shows that 58% of employees who left a job because of the workplace culture cited bad managers as the ultimate reason they left.
What to do about it: Assess your leadership candidates’ leadership and people management abilities before bringing them aboard to ensure they’re capable of managing effectively.
4. Unhealthy workplace culture
What the stats say: Researchers for the MIT Sloan Management Review found that toxic culture is ten times more predictive of attrition than compensation.
What to do about it: Take steps to improve your workplace culture. For instance, use cultural assessments – like TestGorilla’s Culture Add test – to identify and hire candidates who align with and contribute positively to your workplace environment.
5. Lack of flexibility
What the stats say: The demand for flexible work arrangements has surged since the pandemic and is likely here to stay. One poll by People Management found that 77% of workers would now choose a flexible work option over a pay increase. In addition, BLS data also highlights that providing family care and gaining access to childcare have been major reasons for employee turnover – and inflexible work arrangements can make these tasks more challenging.
What to do about it: Consider offering more flexible options for your employees – including those with family care responsibilities.
6. Inadequate compensation
What the stats say: The SHRM’s “Better Workplaces on a Budget” 2022 survey found that the most common reason for employees leaving their roles for other opportunities is feeling undercompensated. Wage stagnation is a primary driver in industries with above-average turnover rates, like retail and food services.
What to do about it: Offer transparent, skills-based compensation packages – rewarding employees for the abilities and knowledge they bring to your company.
Reduce your employee turnover with skills-based assessments
Employee turnover can be an inevitable, pressing, and costly challenge for HR managers, executives, and recruiters. With the right strategies, you can reduce its impact.
Reducing turnover starts at the hiring stage. TestGorilla’s skills assessments empower organizations to make data-driven hiring decisions. By using these to screen your candidates, you can:
Identify high-retention candidates
Identify strengths and areas for improvement to inform professional development and create tailored career paths
In fact, we surveyed 1,000+ employers for our 2024 State of Skills Based Hiring report and learned that 91% of employers using skills-based hiring practices – such as skills assessments – are seeing improved retention. In addition, 88% believe that skills-based hires stay in their roles longer.
Use our ROI calculator today to learn how much we can reduce your voluntary turnover rate.
FAQs
What are employee turnover statistics?
Employee turnover statistics are a collection of metrics – often expressed as percentages or ratios – that show how frequently employees leave their companies during given time periods. These statistics can include various measures, such as the overall turnover rate, voluntary turnover rate, or involuntary turnover rate. They can also include turnover rates for specific areas, including turnover by department, position, tenure, work type, business size, or industry.
What is a normal employee turnover rate?
Several online sources (including the SHRM) suggest aiming for a turnover rate of less than 10%. However, “normal” turnover rates can vary significantly depending on factors – like industry, business size, and economic conditions. You must consider your turnover rate holistically: Examine why people are leaving, whether their departures are preventable, how your rate compares with industry averages, and more.
You've scrolled this far
Why not try TestGorilla for free, and see what happens when you put skills first.


