65 Pandas interview questions to hire top data scientists
Pandas is a powerful open-source data manipulation and analysis library for Python and an invaluable tool for data manipulation and analysis.
However, to make full use of it, it’s crucial to hire expert data analysts and scientists who are proficient in Pandas and can transform vast amounts of raw data into meaningful and organized information. Without them, your data analysis efforts might simply fall short and not live up to your expectations.
To help you assess candidates’ proficiency with Pandas, we have compiled a set of 65 Pandas interview questions, along with sample answers to 25 of them.
Before you start interviewing candidates, however, we advise you to use a Pandas skills test to identify top talent – and not waste time with unqualified candidates.
Top 25 Pandas interview questions to hire skilled developers and data scientists
In this section, you’ll find our selection of the best 25 interview questions to evaluate candidates’ Pandas skills, along with sample answers to help with the assessment process.
1. What is Pandas and what are its primary data structures?
Pandas is a widely-used Python library designed for data manipulation and analysis. It offers two primary data structures:
DataFrame, which is akin to a table with rows and columns, similar to an Excel spreadsheet or a SQL table
Series, which is like a single column from that table
These structures allow users to analyze large datasets with ease.
2. How do you import Pandas in Python?
To start using Pandas in their Python script, developers need to import it with an import statement: import pandas as pd.
The pd is an alias, a common shorthand that makes it easier to call Pandas functions without typing the full library name each time. This step is key for using any of Pandas’ features for data manipulation and analysis.
3. How do you create a DataFrame from a dictionary?
Creating a DataFrame from a dictionary in Pandas is straightforward. Candidates should explain they’d use the pd.DataFrame() function, passing in their dictionary as an argument.
Each key in the dictionary becomes a column in the DataFrame, and the corresponding values form the rows. This method is efficient for converting structured data, like records or tables, into a format that is easy to manipulate and analyze in Pandas.
4. Explain how to read a CSV file into a Pandas DataFrame.
Reading a CSV file into a Pandas DataFrame is simple with the pd.read_csv() function, which provides a path to the CSV file.
Pandas then parses the CSV file and loads its content into a DataFrame. This function handles various file formats and delimiters, offering flexibility for different types of CSV files.
5. What is the method to display the first 5 rows of a DataFrame?
Knowledgeable candidates will explain that to see the first five rows of a DataFrame, they’d use the .head() method. This method is very useful for quickly inspecting the beginning of a dataset, enabling the user to check the data and column headers.
By default, .head() returns the first five rows, but they can pass a different number as an argument if they want to see more or fewer rows.
6. What’s the function to check the data types of columns in a DataFrame?
For this, developers would need to use the .dtypes attribute.
This attribute returns a series with the data type of each column, helping them understand the kind of data they’re working with. This is crucial for effective data cleaning and analysis.
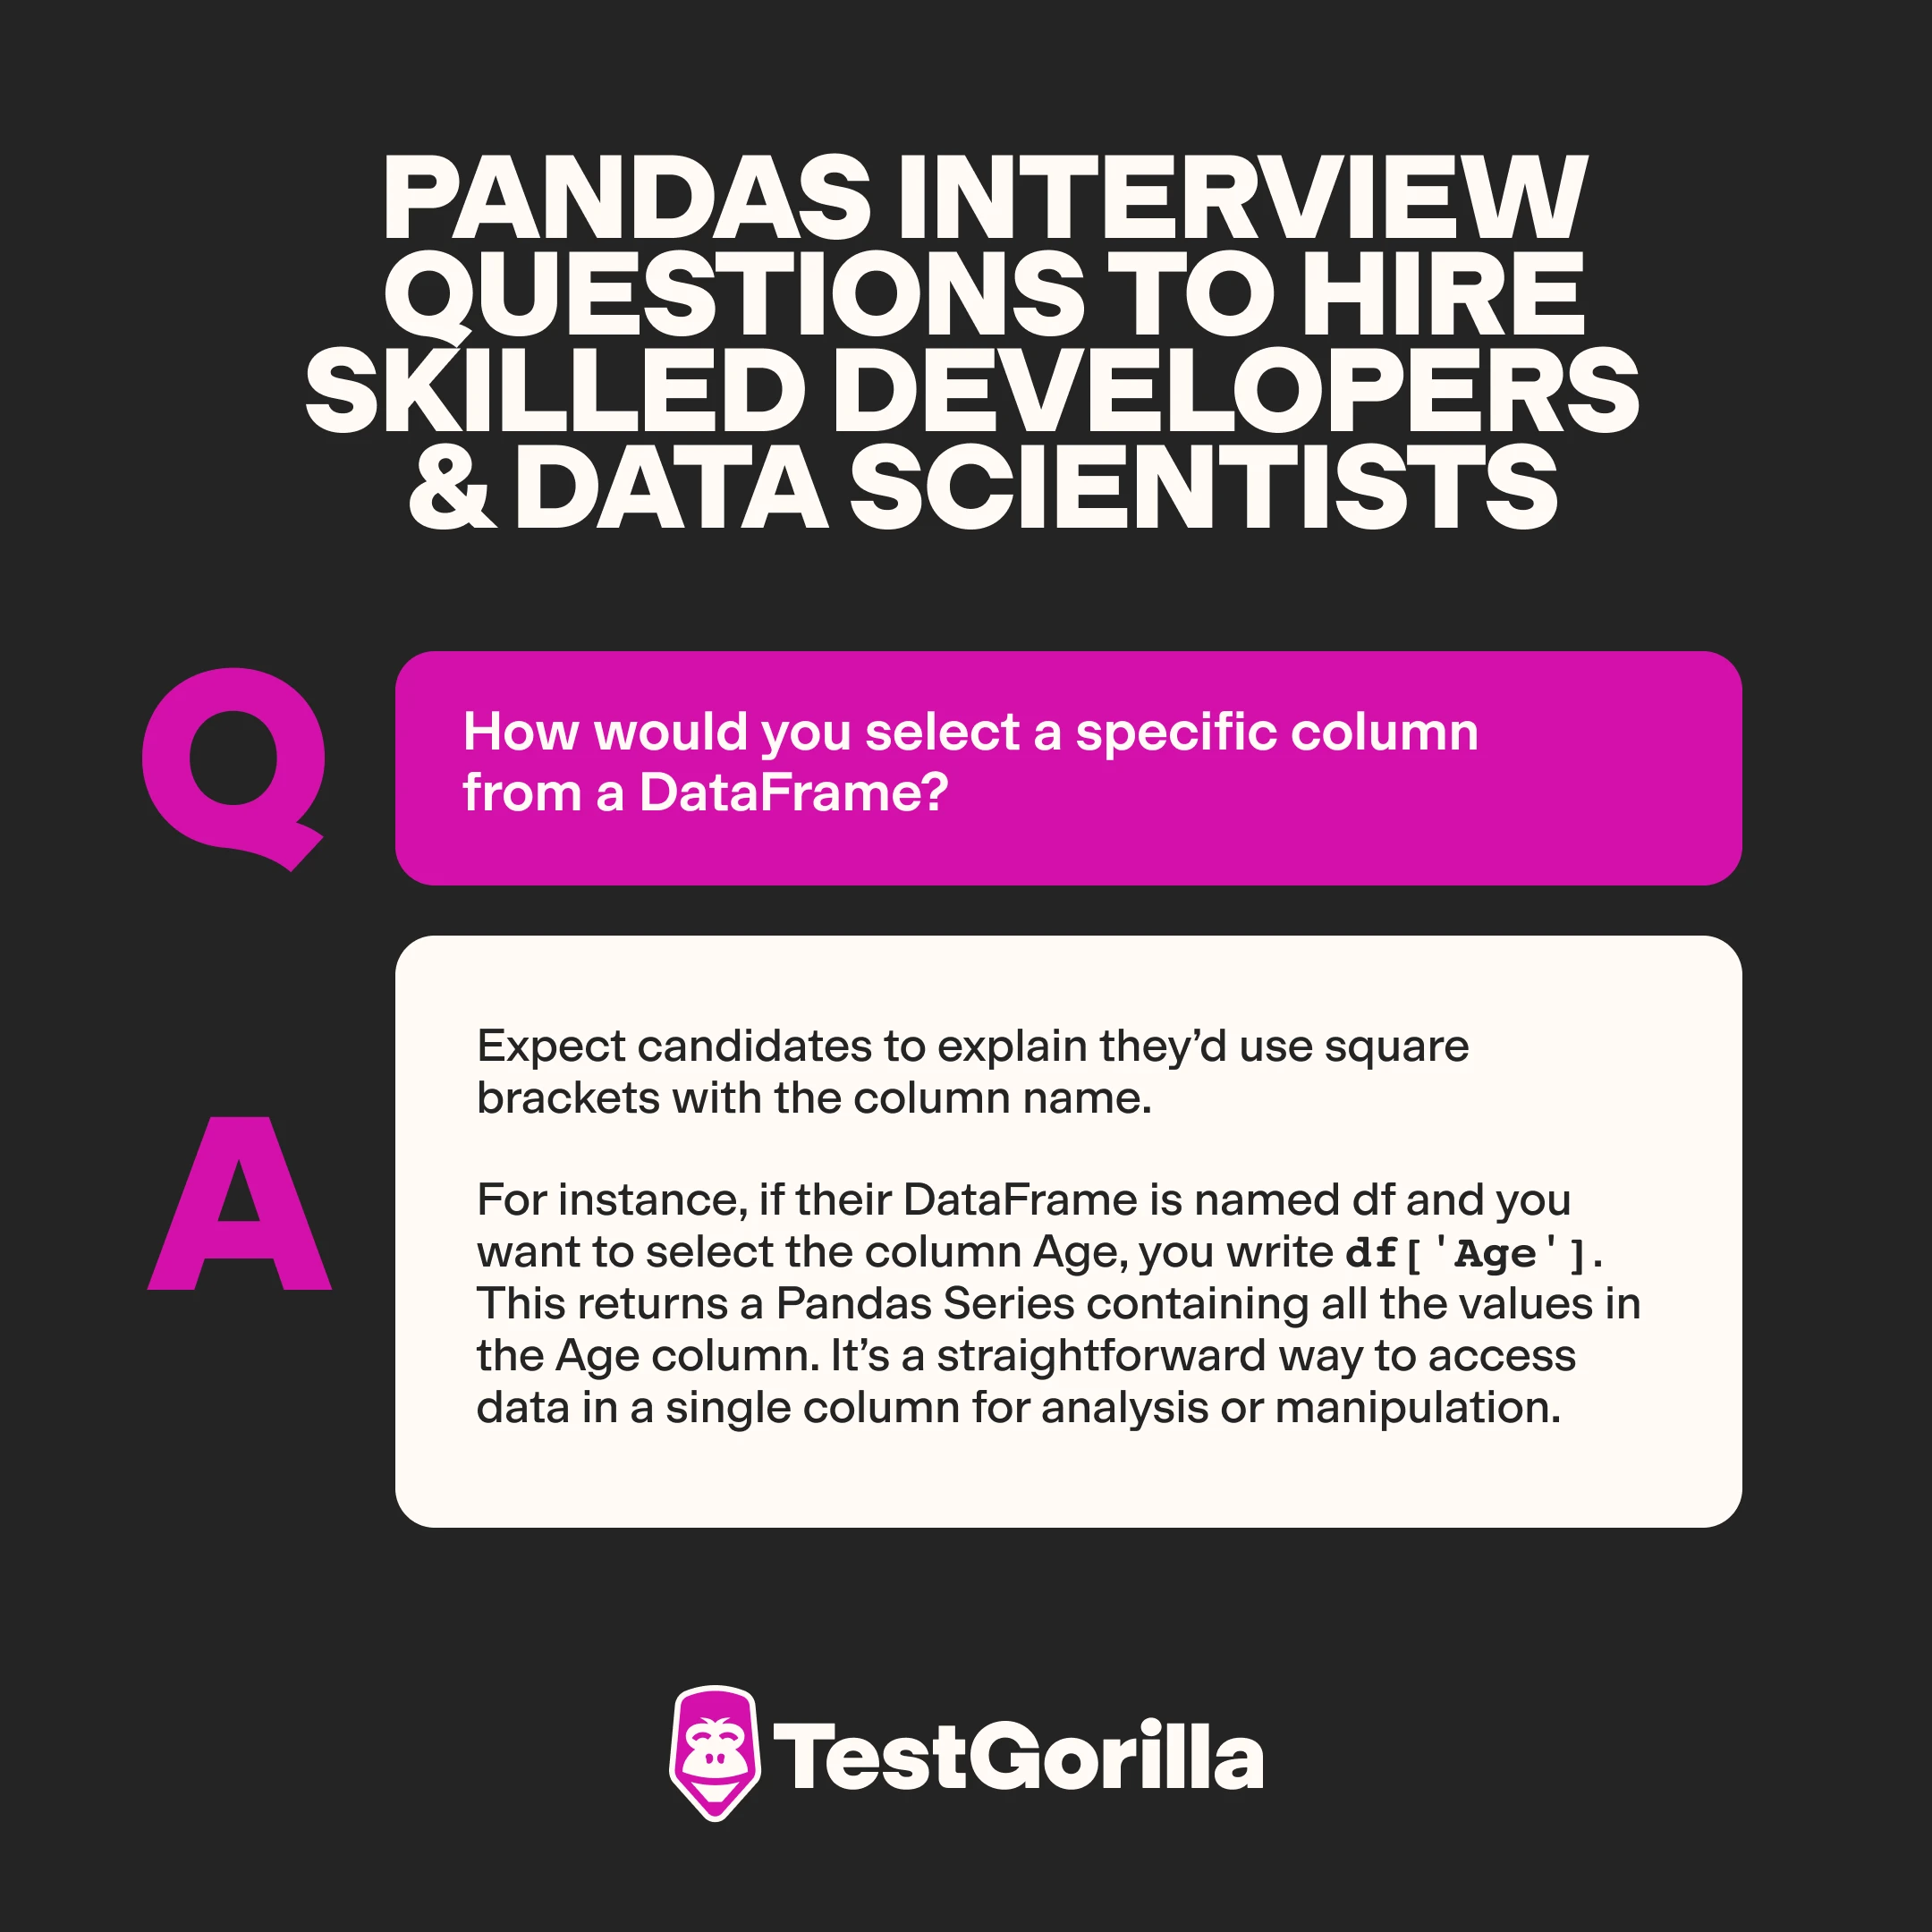
7. How would you select a specific column from a DataFrame?
Expect candidates to explain they’d use square brackets with the column name.
For instance, if their DataFrame is named df and you want to select the column Age, you write df['Age']. This returns a Pandas Series containing all the values in the Age column. It’s a straightforward way to access data in a single column for analysis or manipulation.
8. Which method would you use to filter rows based on a condition?
Experienced candidates will explain they’d use the DataFrame's ability to perform boolean indexing.
They’d write a condition inside the square brackets, such as df[df['Age'] > 30] to get all rows where the Age column has values greater than 30. This method returns a new DataFrame with only the rows that meet the specified condition, making it easy to analyze subsets of your data.
9. What methods are available to handle missing values in a DataFrame?
To handle missing values in a DataFrame, candidates could use:
The
dropna()method, which removes any rows or columns with missing valuesThe
fillna()method, which replaces missing values with a specified valueThe
interpolate()method, which fills in missing values using interpolation
These methods provide flexible options to clean data and handle gaps due to missing entries.
10. What function can you use to fill missing values with a specific value?
For this, developers could use the fillna() function, which enables them to specify a value that will replace all the missing entries in the DataFrame.
For example, if they want to replace all NaN values with 0, they’d call df.fillna(0). This function helps ensure their dataset is complete and ready for analysis by filling in the gaps with a meaningful value.
11. Which function helps in summarizing the basic statistics of a DataFrame?
Experienced candidates will know that the describe() function in Pandas provides a summary of the basic statistics for a DataFrame.
It includes measures such as:
Count
Mean
Standard deviation
Minimum and maximum values,
The 25th, 50th, and 75th percentiles
This function is particularly useful for getting a quick overview of the data's distribution and identifying any potential outliers or anomalies.
12. How can you count the number of unique values in a column?
To count the number of unique values in a column, the user can recruit the nunique() function.
When applied to a DataFrame column, nunique() returns the number of distinct values present in that column. This function is helpful for understanding the diversity or variability within a column, such as counting the number of unique categories in a categorical variable.
13. What are the steps to create a scatter plot using Pandas?
Expect candidates to outline a process where they would:
Ensure they have Matplotlib installed, as Pandas uses it for plotting
Use the
plot.scatter()method on their DataFrameSpecify the columns for the x and y axes, like this:
df.plot.scatter(x='column1', y='column2')
This generates a scatter plot, enabling users to visualize the relationship between the two variables.
Our Matplotlib test enables you to assess candidates’ skills in solving situational tasks using the functionalities of this Python library.
14. Explain how to group data by a specific column and calculate aggregate statistics.
Candidates should explain they’d use the groupby() method, which enables them to split the data into groups based on the values in one or more columns.
After grouping, they can apply aggregate functions like mean(), sum(), or count() to each group. For example, df.groupby('Category').mean() will calculate the mean of each numerical column for each category.
15. What’s the use of the apply function in Pandas?
The apply() function enables data analysts to apply a function along an axis of the DataFrame. This means they can apply a function to each row or each column of the DataFrame; it’s useful for performing complex operations that are not built into Pandas.
16. What’s the purpose of groupby in data analysis?
The groupby() function in Pandas is used to split the data into groups based on some criteria. It’s often followed by an aggregation function to summarize the data.
The purpose of groupby is to enable users to perform operations on subsets of their data, like calculating the sum, mean, or count for each group. This is particularly useful for exploratory data analysis and for understanding patterns within your data.
17. Describe how to perform hierarchical indexing.
Hierarchical indexing, or multi-level indexing, enables users to have multiple levels of indices in a DataFrame. They can create a hierarchical index by passing a list of columns to the set_index() method. This enables them to work with higher-dimensional data in a lower-dimensional DataFrame.
It’s useful for complex data manipulations and for performing more advanced data slicing, grouping, and analysis.
18. What is vectorization? What are its advantages?
Vectorization is the process of performing operations on entire arrays or series without using explicit loops. In Pandas, vectorized operations are performed using optimized C and Fortran libraries, making them much faster than traditional loops in Python.
The benefits of vectorization include:
Improved performance
Cleaner, more readable code
Efficient data processing, especially with large datasets, by leveraging the power of NumPy
To evaluate applicants’ NumPy proficiency, you can use our NumPy test.
19. How do you save a DataFrame to an Excel file?
Expect candidates to explain they’d use the to_excel() method and specify the file name as an argument.
For example, df.to_excel('output.xlsx') saves the DataFrame df to an Excel file named 'output.xlsx'. This method also enables users to customize the sheet name and other parameters if needed.
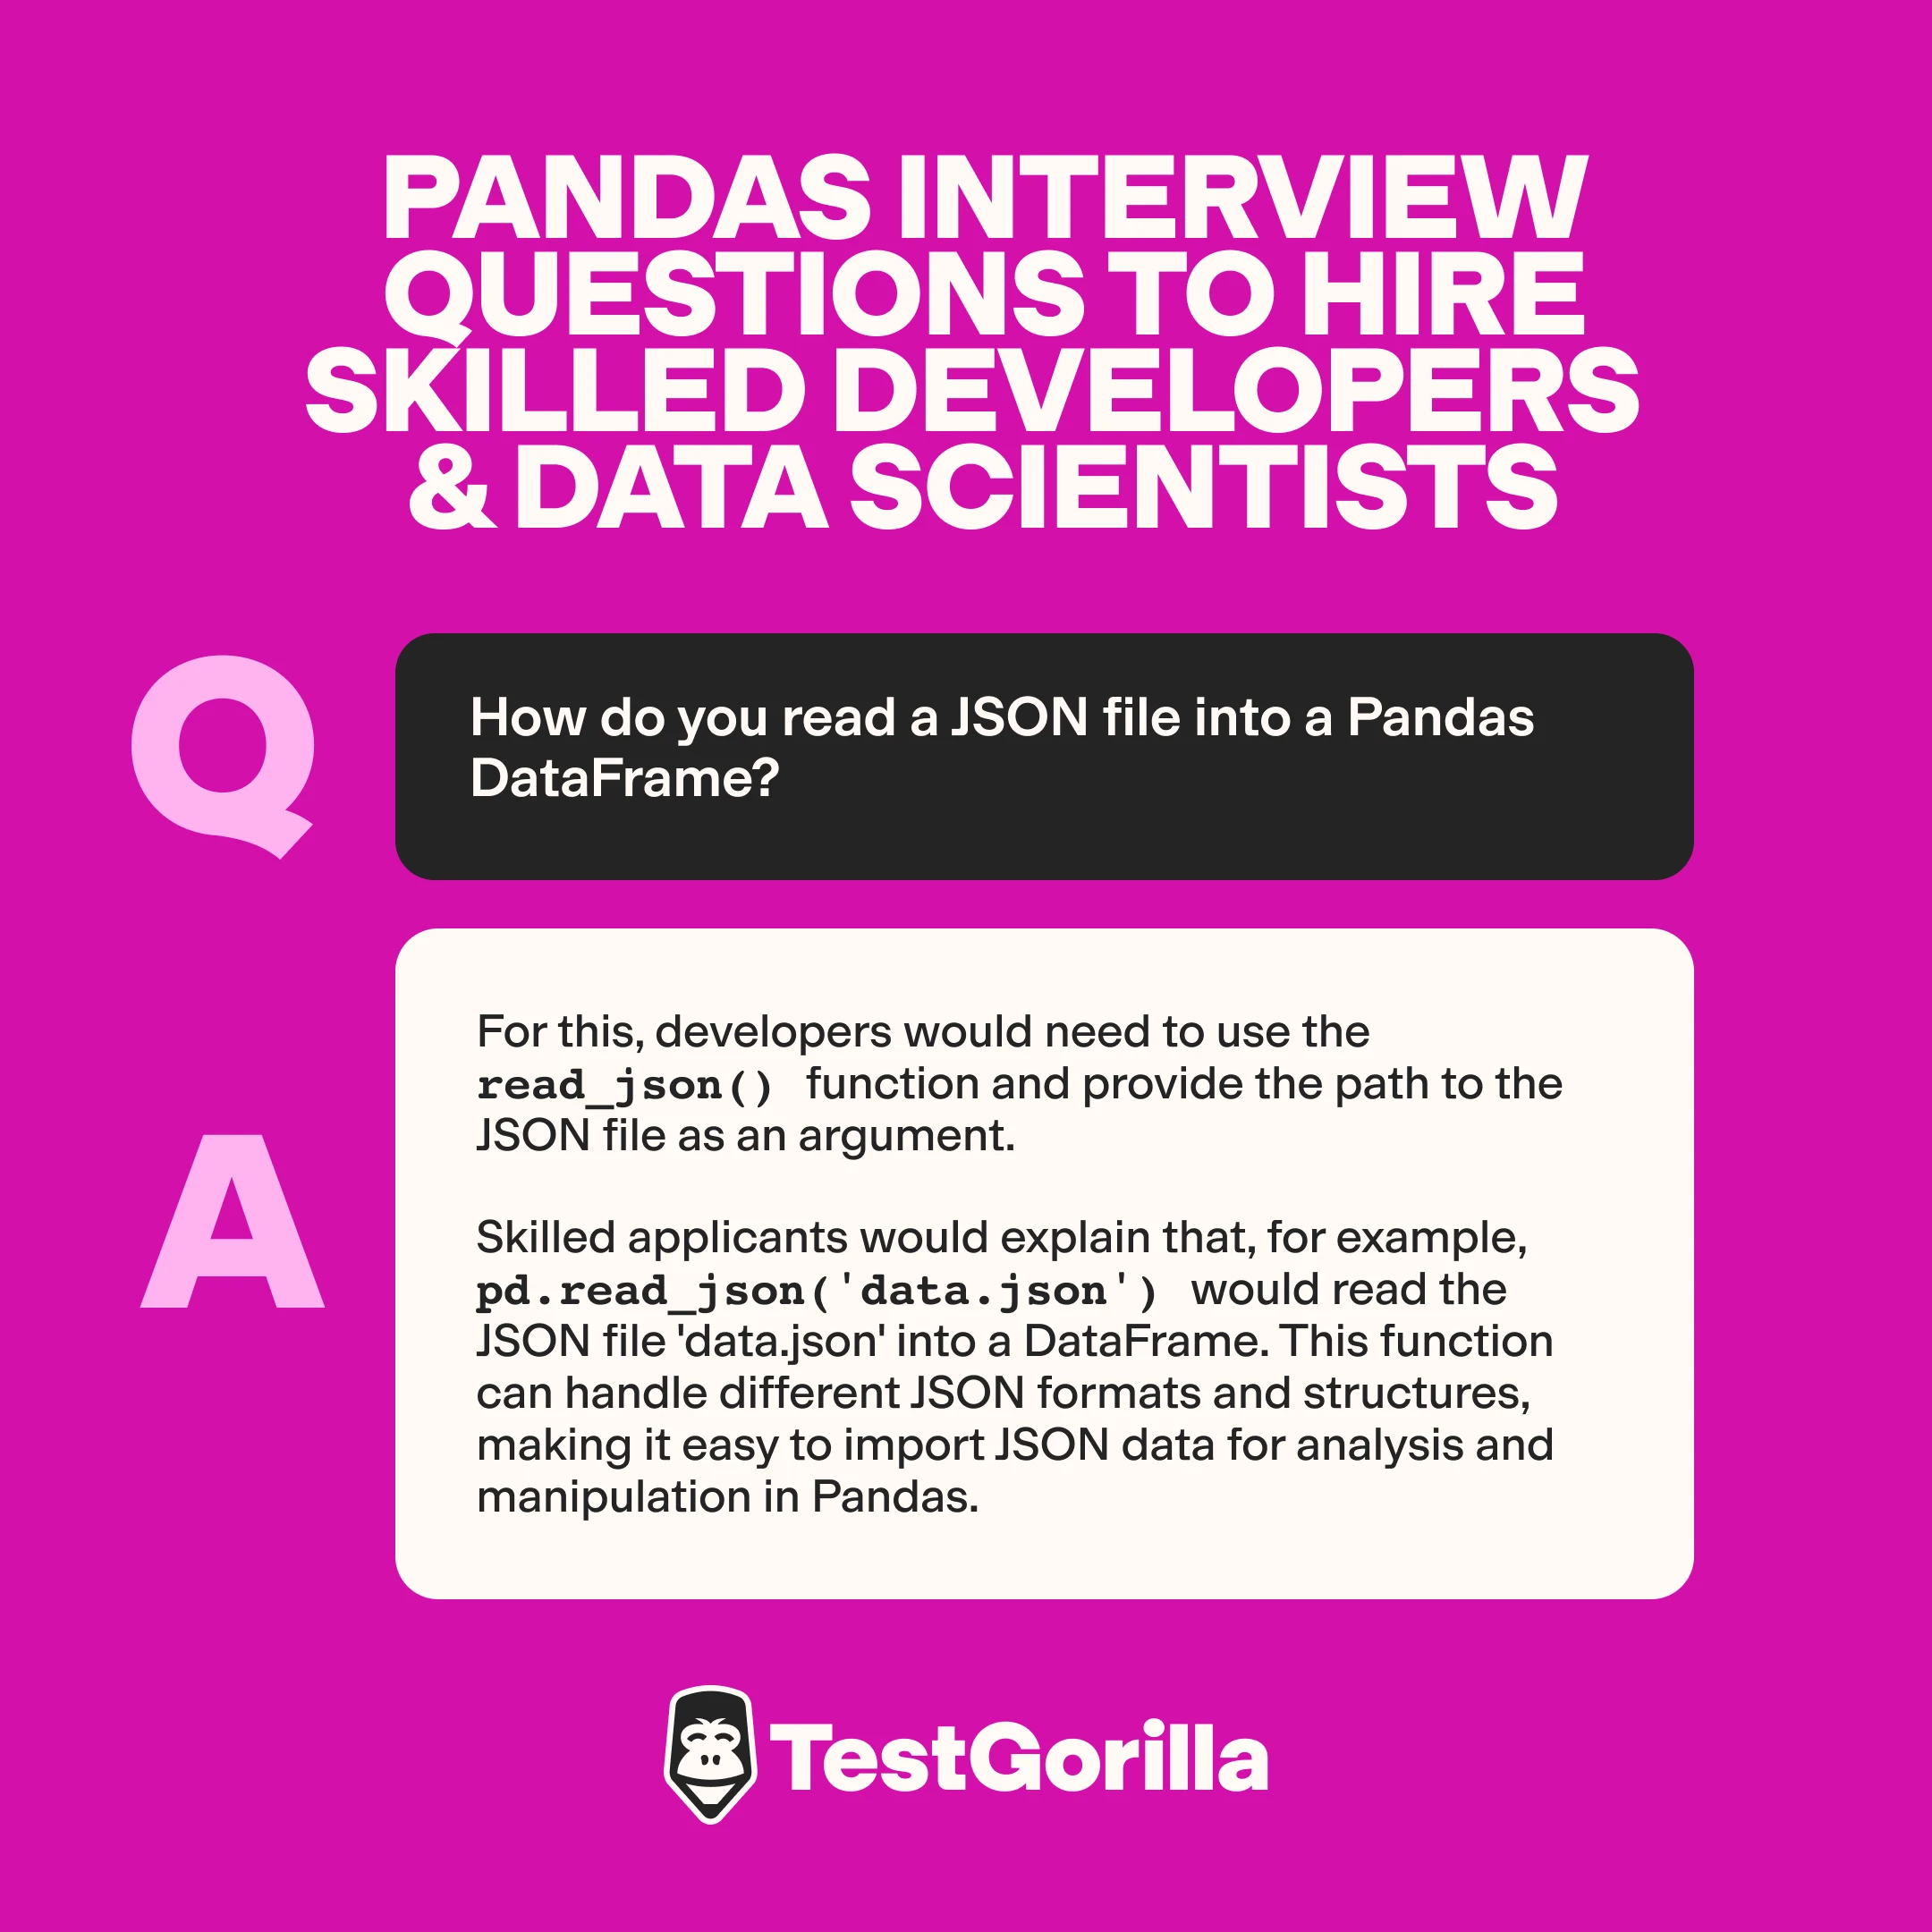
20. How do you read a JSON file into a Pandas DataFrame?
For this, developers would need to use the read_json() function and provide the path to the JSON file as an argument.
Skilled applicants would explain that, for example, pd.read_json('data.json') would read the JSON file 'data.json' into a DataFrame. This function can handle different JSON formats and structures, making it easy to import JSON data for analysis and manipulation in Pandas.
21. Explain how to read and write data to a HDF5 file.
To read and write data into a HDF5 file using Pandas, users need to use the HDFStore class and methods like to_hdf() and read_hdf():
To write data, they’d need to use
df.to_hdf('data.h5', key='df', mode='w'), which would save the DataFrame df to an HDF5 file named 'data.h5'To read data, they’d need to use
pd.read_hdf('data.h5', 'df')to load the DataFrame
HDF5 is particularly useful for handling large datasets efficiently.
22. Describe a scenario where you would use Pandas for data cleaning.
Pandas is a top choice for data cleaning when dealing with datasets with inconsistencies, missing values, or which need reformatting.
For instance, if you have a CSV file with customer information that includes missing ages, incorrect date formats, and duplicate entries, you can use Pandas to handle all those issues.
Functions like dropna(), fillna(), astype(), and drop_duplicates() help clean and standardize the data for further analysis.
23. What are the steps to preprocess data for machine learning using Pandas?
Candidates should explain that preprocessing data involves the following steps:
Load their dataset into a DataFrame
Handle missing values using methods like fillna() or dropna()
Convert categorical variables into numeric using techniques like one-hot encoding (
get_dummies())Normalize or standardize numerical features
Remove irrelevant or redundant features
Split data into training and testing sets
These steps would ensure their data is clean and suitable for model training.
Use a Machine Learning test to gain deeper insight into candidates’ skills.
24. Describe a sample use case for Pandas in financial data analysis.
In financial data analysis, Pandas is used to manage and analyze time-series data, such as stock prices, trading volumes, and financial ratios.
For instance, you can use Pandas to load historical stock price data, calculate moving averages, and identify trends or anomalies. With functions like resample() and rolling(), you can aggregate and smooth data to better understand market behaviors.
25. What steps would you take to verify the integrity of your DataFrame?
To verify the integrity of a DataFrame, candidates would:
Start by checking for missing values using
isnull().sum()Ensure data types are correct with
dtypesUse
describe()to review basic statistics and identify anomaliesCheck for duplicate rows with
duplicated()Validate data ranges and consistency with logical checks and custom conditions
Use domain knowledge to inspect sample records
This process helps ensure the data aligns with expectations and business rules.
Extra 40 Pandas interview questions you can use to assess applicants’ skills
If you need more ideas, we’ve got you covered. Below, you’ll find a selection of 40 additional interview questions you can ask candidates to evaluate their experience with Pandas.
If you’d like to assess Python skills in depth, check out our Python interview questions or our Data Structures and Objects in Python test.
How do you remove duplicate rows in a DataFrame?
Explain how to convert a column to a different data type.
What’s the method to rename columns in a DataFrame?
Describe how to apply a function to each element in a column.
How can you create a new column based on the values of another column?
What are the ways to handle outliers in a DataFrame?
What method would you use to find the correlation between columns in a DataFrame?
How do you generate a box plot for visualizing the distribution of data in a column?
How do you merge two DataFrames?
What’s the difference between
mergeandconcatfunctions in Pandas?Explain the use of the
meltfunction.What’s the purpose of the
mapfunction in Pandas?How can you filter DataFrame rows based on multiple conditions?
Describe how to perform a left join on two DataFrames.
What are some use cases for the
pivot_tablefunction?How do you use the cut function to bin continuous data into discrete intervals?
Explain how to perform a rolling window calculation.
How can you resample time-series data in Pandas?
What is the purpose of the
qcutfunction?How can you improve the performance of your Pandas code?
What is the use of eval and query functions in Pandas?
Explain how to work with large datasets that don't fit into memory.
How do you optimize memory usage in a DataFrame?
What is the impact of setting the appropriate data types on DataFrame performance?
What is the method to read data from a SQL database into a DataFrame?
Describe the process to save a DataFrame to a SQL database.
How can you integrate Pandas with Matplotlib for plotting?
What are the ways to export a DataFrame to a CSV file?
How can Pandas be used for time-series analysis?
Explain how to use Pandas for data aggregation and summarization.
How can you use Pandas to analyze web scraping data?
Explain how to handle text data in Pandas.
What are common errors encountered in Pandas and how do you resolve them?
How do you handle a situation where your DataFrame operations are slow?
Describe how to troubleshoot issues with missing or incorrect data in a DataFrame.
Discuss the importance of data types in Pandas.
What are best practices for handling large datasets in Pandas?
Explain the importance of indexing in Pandas.
What are the benefits of using chaining methods in Pandas?
How do you use the crosstab function for contingency tables?
The best insights on HR and recruitment, delivered to your inbox.
Biweekly updates. No spam. Unsubscribe any time.
Find top Pandas experts with a skills-first approach to hiring
To find data analysts with excellent Pandas skills, use skills tests and structured interviews.
This way, you get to identify top talent in your talent pool quickly and efficiently – and give all candidates an equal chance to prove their skills.
Today, 85% of employers use a skills-first approach to hiring, which enables them to make better hires at a fraction of the time. With our Pandas test and the 60+ Pandas interview questions above, you’ll be sure to achieve the same results.
Sign up for a free live demo to chat with one of our experts and see how our platform can help you simplify and speed up your hiring process – or try out our Free forever plan to see for yourself how easy it is to evaluate candidates’ abilities with skills tests.
Related posts
You've scrolled this far
Why not try TestGorilla for free, and see what happens when you put skills first.


